State of Medical Imaging Capacity in Europe: MRI and CT Scanners by Country

Europe added MRI units almost twice as fast as CT scanners between 2013 and 2023, and half of those MRI units now sit outside hospitals. This report analyzes Eurostat’s “Devices for medical imaging” dataset (hlth_rs_medim, updated July 13, 2026) across up to 32 European countries.
Key findings
- MRI capacity grew 48% in a decade. The 28 countries reporting in both years went from 7,616 MRI units in 2013 to 11,282 in 2023.
- PET grew fastest; gamma cameras shrank. PET scanners rose 74% (676 to 1,178 across 29 countries). Gamma cameras fell 4%, the only category to decline.
- CT grew 27%, from 11,162 to 14,147 scanners across 30 countries.
- Access differs more than fourfold between countries. Greece had 3.92 MRI units per 100,000 inhabitants in 2023 and Germany 3.71. Malta had 0.90, and Hungary reported 0.58 under a differing national definition.
- Romania expanded faster than any other country. MRI units rose 260% (87 to 313) and CT scanners 171% (194 to 526).
- Half of MRI units are outside hospitals. Providers of ambulatory health care held 50% of MRI units in 2023, up from 43% in 2013 across the 22 countries reporting both years. For CT, the share rose from 29% to 33% across 25 countries.
- The data counts machines, not scans. Equipment density shows capacity. It does not show how intensively that capacity is used.
Installed base: a decade of growth
Advanced cross-sectional and molecular imaging expanded quickly from 2013 to 2023, while older nuclear medicine equipment declined. Each row compares the same set of countries in both years, so the totals are matched and not Europe-wide.
| Equipment | Countries matched | Units, 2013 | Units, 2023 | Change |
|---|---|---|---|---|
| PET scanners | 29 | 676 | 1,178 | +74% |
| MRI units | 28 | 7,616 | 11,282 | +48% |
| Radiation therapy equipment | 24 | 1,759 | 2,235 | +27% |
| CT scanners | 30 | 11,162 | 14,147 | +27% |
| Mammographs | 24 | 6,496 | 6,973 | +7% |
| Gamma cameras | 25 | 2,508 | 2,408 | -4% |
MRI added 3,666 units in the matched group, more than any other modality. CT added 2,985. PET grew from a small base: three countries (Cyprus, Iceland, Latvia) reported no PET scanner in 2013 and at least one by 2023.
The drop in gamma cameras alongside the rise in PET points to a shift within nuclear medicine toward PET-based imaging.
Country rankings: units per inhabitant
Equipment density varies more than fourfold across Europe, and the leading countries differ by modality. All rankings use 2023 data and count units in hospitals and ambulatory health care providers together.
MRI
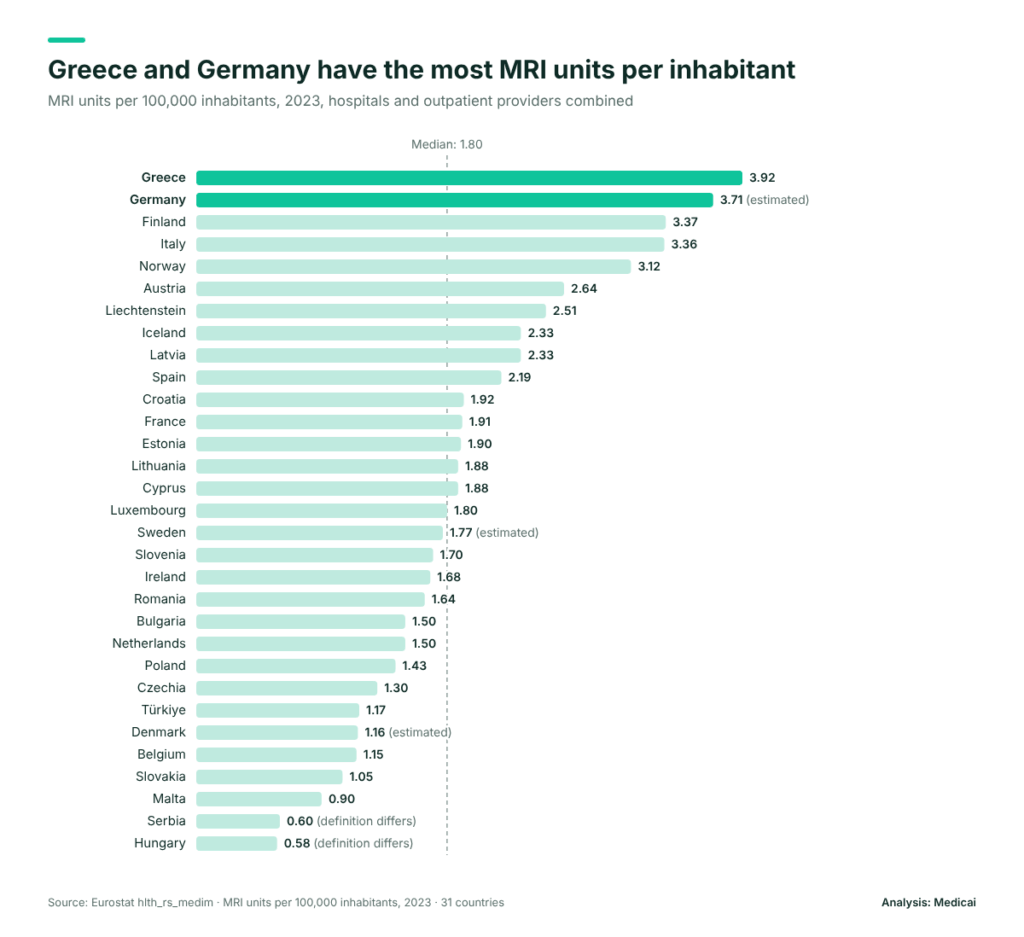
Greece has 4.4 times Malta’s MRI density, the lowest country reporting under the standard definition. Romania sits below the median despite the decade’s fastest growth, showing how low its starting point was.
CT
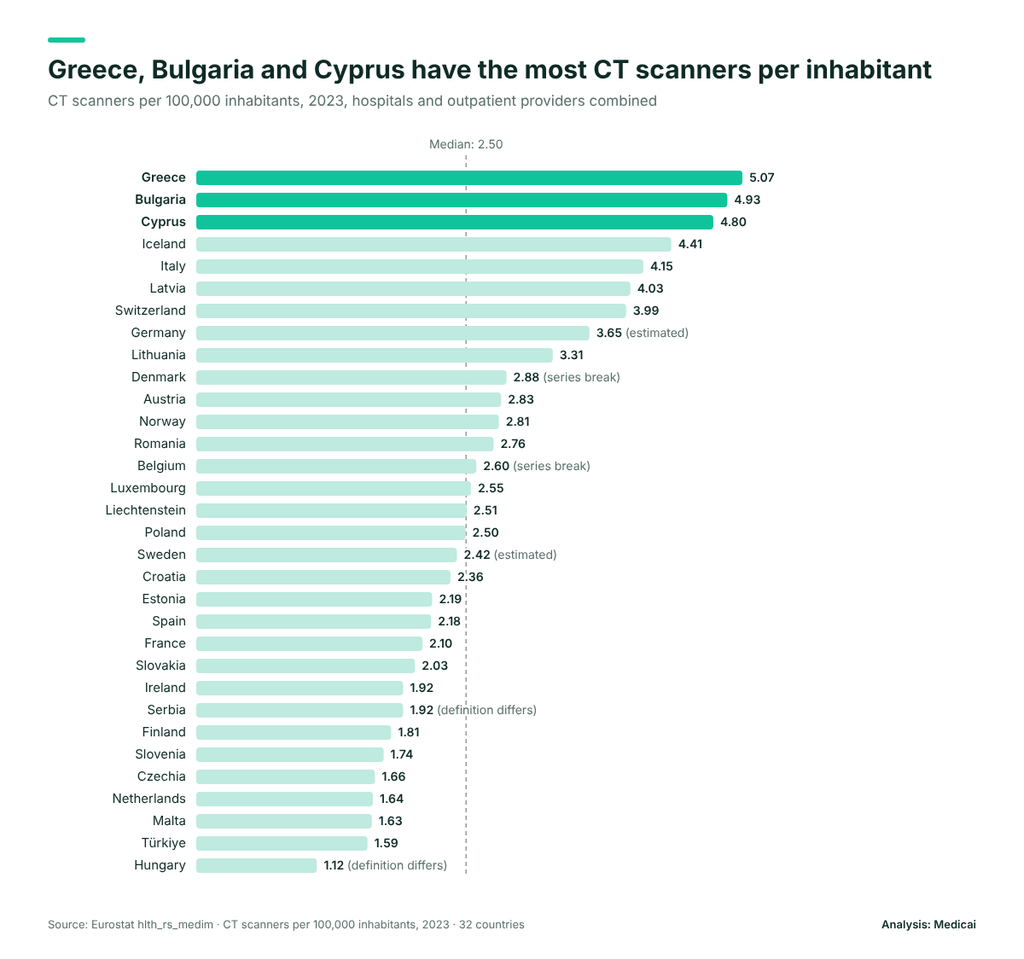
CT density does not track national income. The Netherlands, Finland, and France all sit below the median, while Bulgaria and Latvia rank in the top six. Among countries reporting under the standard definition, Greece’s density is 3.2 times that of Türkiye’s.
PET
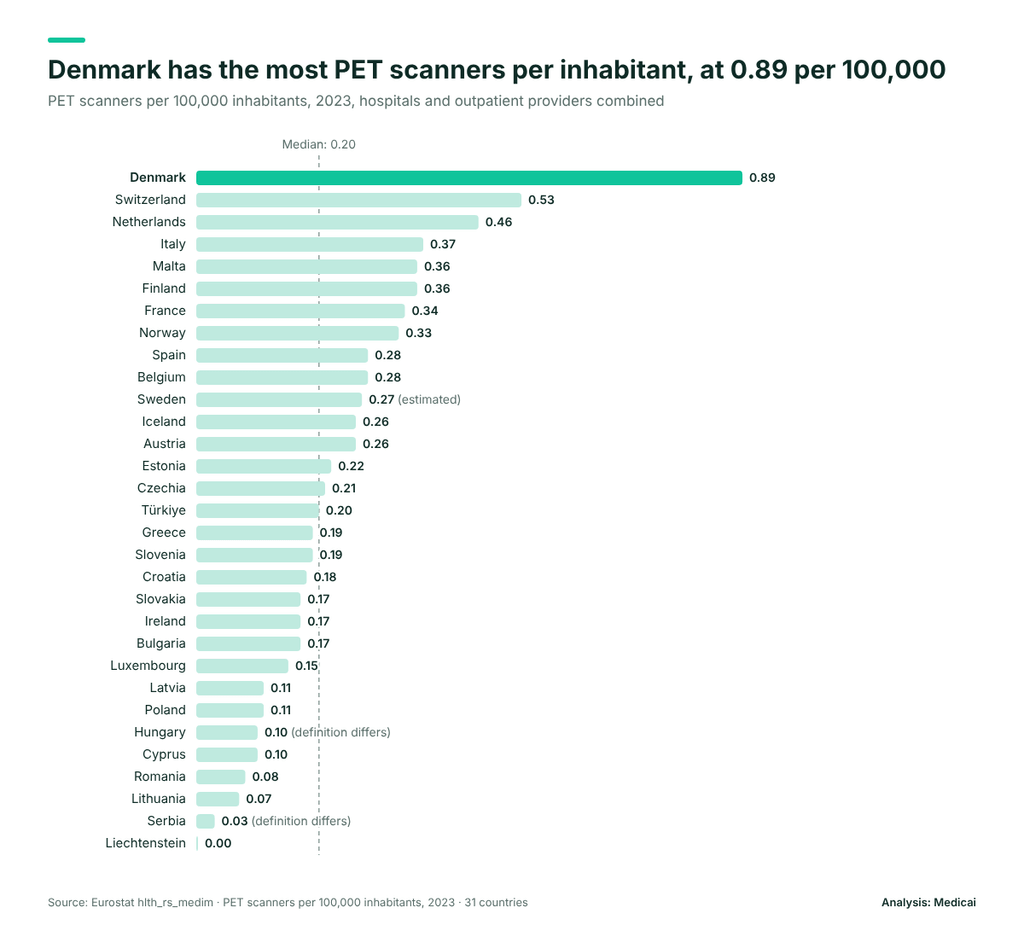
PET is the most unevenly distributed modality. Denmark’s density is more than four times the median, and most Central and Eastern European countries sit below it.
Liechtenstein reports one MRI unit and one CT scanner for a population of about 40,000, so its ratios reflect population size more than capacity.
Fastest and slowest growing countries
Growth was concentrated in Central and Eastern Europe, where countries started the decade with few machines. At least five countries doubled their MRI count.
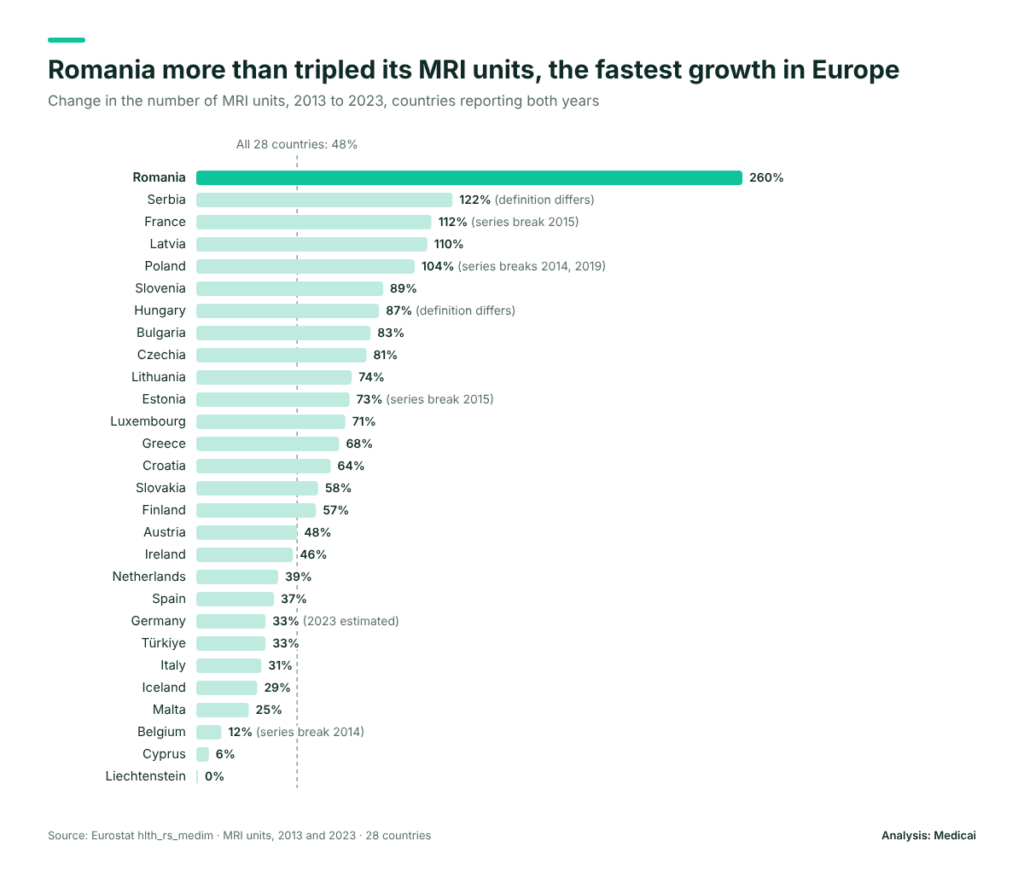
Romania’s series is continuous and carries no data flags: MRI units rose every year, from 87 in 2013 to 313 in 2023. France went from 618 to 1,311 units, the largest absolute gain after Germany’s 758.
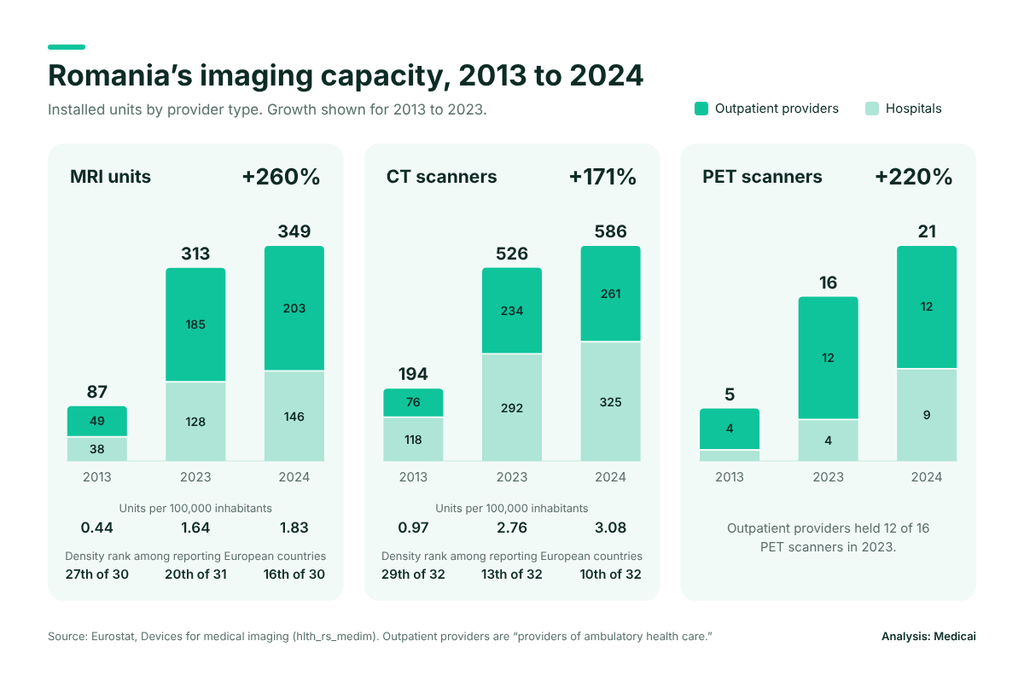
CT followed the same pattern at a lower rate. Romania again led (+171%, from 194 to 526 scanners), followed by Serbia (+79%), Cyprus (+64%), and the Netherlands and France (+51% each). Austria (+3%), Latvia (+9%), and Germany (+12%) grew the least among countries with comparable series.
Mature markets grew slowly in percentage terms because they started high. Germany alone held 3,090 MRI units in 2023, more than a quarter of the matched total.
Hospital versus outpatient
Half of the MRI units in reporting countries now sit outside hospitals. Eurostat’s category is “providers of ambulatory health care,” which covers standalone imaging centers, clinics, and physician practices.
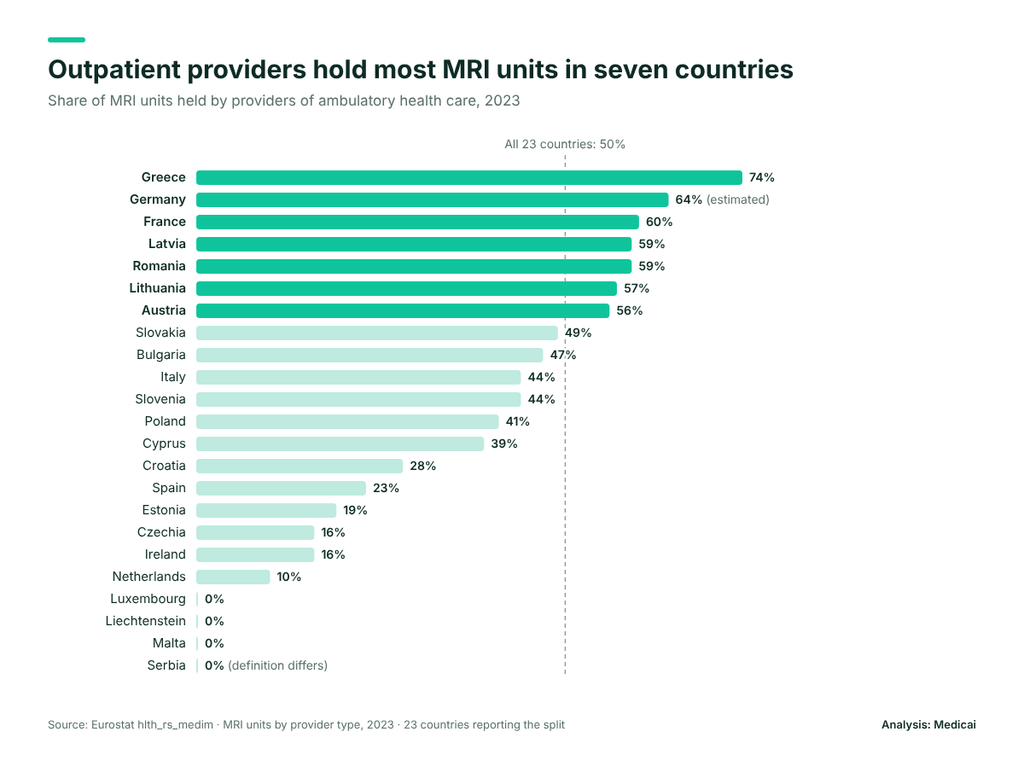
The shift is measurable over the decade. Across the 22 countries reporting the split in both years, the outpatient share of MRI units rose from 43% in 2013 to 50% in 2023. For CT, it rose from 29% to 33% across 25 countries.
France accounts for much of that change. Its outpatient MRI count went from 133 to 785, and Eurostat flags breaks in the French series in 2015 and 2019. Excluding France, the outpatient share of MRI units rose from 46% to 49% and has been stable since 2016. In absolute terms, outpatient MRI units still grew faster than hospital units (75% against 32%).
The pattern differs by modality in 2023:
| Equipment | Countries reporting the split | Share held by providers of ambulatory health care |
|---|---|---|
| MRI units | 23 | 50% |
| Mammographs | 21 | 49% |
| CT scanners | 26 | 33% |
| PET scanners | 24 | 22% |
National models diverge sharply. Greece, Germany, and France run most MRI capacity through outpatient providers. The Netherlands, Ireland, and Czechia keep at least 84% of it in hospitals. Greece is also the only country where outpatient providers hold most CT scanners (61%).
Machines versus scans
Equipment counts show capacity, not use. Eurostat’s separate exam dataset (hlth_co_exam) shows how hard each machine works. In 2023, Belgium recorded 9,986 MRI exams per MRI unit and France 7,875. Greece, which leads Europe in MRI density, recorded 3,431. Romania recorded 2,640, the fourth-lowest of 27 reporting countries.
Romania’s scan volume grew faster than its machine count. MRI exams rose from 177,733 in 2013 to 826,304 in 2023, up 365%, while MRI units rose 260%.
Exam counts are less comparable than unit counts. Hungary counts only exams funded by its national insurer, and Denmark added private providers only from 2014.
What this means for imaging data infrastructure
The three trends point in the same direction: more scanners, in more places, owned by more types of providers. The points below are our interpretation of the Eurostat figures, not findings in the dataset itself.
- Capacity is growing fastest in data-heavy modalities. MRI and PET produce large, multi-series studies. A 48% rise in MRI units and a 74% rise in PET scanners expands the number of sites that must store, route, and retain those studies.
- Imaging now happens across organizational boundaries. When half of MRI units sit with ambulatory health care providers, a patient’s scan is often acquired outside the hospital that treats them. The study must reach the referring clinician, and prior exams must follow the patient.
- Fast-growing markets are building from a low base. Romania more than tripled its MRI count in ten years. Sites installed in that period chose their archive and sharing setup recently, and many will face a first replacement cycle within the decade.
- Equipment density is not the same as access. Greece leads Europe in MRI and CT units per inhabitant, with most of them in ambulatory settings. A high unit count spread across many small providers increases the need for interoperability.
These conditions are what cloud PACS and medical image sharing are designed for: many acquisition sites, mixed ownership, and studies that need to move between them.
Frequently asked questions
Which European country has the most MRI scanners per person?
Greece has the most MRI units per 100,000 inhabitants in 2023, with 3.92, followed by Germany at 3.71, according to Eurostat. Malta had the lowest density among countries using the standard definition, at 0.90.
How many MRI machines are there in Europe?
Eurostat publishes no single Europe-wide total, because country coverage varies by year. The 28 countries that reported in both 2013 and 2023 had 11,282 MRI units in 2023, up 48% from 7,616. Germany alone had 3,090.
What share of MRI scanners in Europe are outside hospitals?
Half. Across the 23 countries that report the split, ambulatory health care providers held 50% of MRI units in 2023, up from 43% in 2013 in the 22 countries reporting both years. Much of that rise comes from France, whose series has breaks. Excluding France, the share has held near 49% since 2016.
Methodology and limitations
All figures come from a single Eurostat dataset and are analyzed without modeling or imputation.
- Source. Eurostat, “Devices for medical imaging” (hlth_rs_medim), DOI 10.2908/HLTH_RS_MEDIM, last updated July 13, 2026. Countries report through the Joint Questionnaire on Health Care Non-Monetary Statistics run by Eurostat, OECD, and WHO-Europe. Definitions follow Commission Regulation (EU) 2022/2294.
- Scope. Six equipment types: CT scanners, MRI units, PET scanners, gamma cameras, mammographs, and radiation therapy equipment. Counts cover hospitals and ambulatory health care providers.
- Reference year. 2023 is the latest year with broad coverage (31 countries for MRI and PET, 32 for CT). Only 7 to 9 countries had reported 2025 at the time of extraction. Portugal, the United Kingdom, and North Macedonia have no 2023 figures for these modalities.
- Decade comparisons. Growth figures use only countries with data in both 2013 and 2023. Denmark, Norway, and Sweden lack 2013 MRI counts and are excluded from MRI growth. Norway and Sweden are excluded from CT growth.
- Density figures. Units per 100,000 inhabitants are Eurostat’s own published rates, not recalculated.
- Outpatient share. Calculated as units held by providers of ambulatory health care divided by total units, for countries reporting both. This covers 23 countries for MRI and 26 for CT in 2023.
Data flags to respect
| Flag | Meaning | Where it matters in this report |
|---|---|---|
| Estimated | Value is an estimate | Germany and Sweden, 2023 (all modalities reported). Denmark MRI, 2023. |
| Definition differs | National definition departs from the standard | Hungary and Serbia, all years used |
| Break in time series | Method changed, so years are not directly comparable | Denmark CT (2015, 2016, 2019, 2023), Finland CT (2018), Belgium CT (2013, 2023), France (2015), Poland (2014, 2019) |
Limitations
- Machines, not scans. The dataset does not measure exam volumes, utilization, or waiting times. Eurostat publishes exam counts separately (hlth_co_exam).
- No Europe-wide total. Country coverage varies by year and modality, so this dataset cannot provide a single EU or European total.
- Reported declines may be artifacts. Denmark and Finland show fewer CT scanners in 2023 than in 2013, but both series contain breaks. These should not be reported as real reductions.
- Flag details are national. Eurostat’s EU-level metadata does not explain what differs in each flagged series. That information sits in the national metadata reports.
Sources

Related Articles


Lets get in touch!
Learn more about how Medicai can help you strengthen your practice and improve your patients’ experience. Ready to start your Journey?
Book A Free Demo